
Pew Releases statistical profile of immigration
Read more about InAlienable.Support Quixote Center's InAlienable program!
InAlienableDaily Dispatch
June 4, 2019
(function(){function async_load(){var s=document.createElement('script');s.type='text/javascript';s.async=true;s.src='https://www.pewhispanic.org/wp-content/plugins/pew-scripts/js/iframeResizer.min.js';s.onload=s.onreadystatechange=function(){var rs=this.readyState;try{iFrameResize([],'iframe#pew25609')}catch(e){}};var embedder=document.getElementById('pew-iframe');embedder.parentNode.insertBefore(s,embedder)}if(window.attachEvent)window.attachEvent('onload',async_load);else window.addEventListener('load',async_load,false)})();
The Pew Research Center released a new report on immigration in the United States providing some interesting insights into immigration trends. Among some key findings:
- The United States has the largest foreign born population of any country at just over 44 million people. Immigrants are 13.6 percent of the U.S. population - below the historic high set in 1890 when foreign born persons were 14.8 percent of the population. [Note: Not mentioned in the Pew report is that the U.S. foreign born population is significantly lower than many other countries as a percent of population, “about half the share in places like Switzerland (30 percent) and Australia (29 percent), and still lower than New Zealand (23 percent), Canada (22 percent), Austria (19 percent), Sweden (18 percent), Ireland (17 percent) and elsewhere” (Justin Gest, Politico)].
- 43 percent of immigrants are naturalized citizens, 27 percent are permanent residents, 5 percent are temporary residents, 25 percent are unauthorized immigrants (a number that has declined since 2008).
- Immigrants from Mexico make up the largest group of foreign born persons - though migration from Mexico has declined in recent years.
- In 2017, the country with the highest new migration to the United States was India.
- Overall, immigration from Asia is increasing faster than from other regions. Asian immigrants are expected to make up the largest share of the foreign born population by 2055.
- 24 percent of immigrants live in California, followed by Texas (11 percent) and New York (10 percent). Two-thirds live in 20 of the largest metropolitan areas in the country.
- Nationally, immigrants do not make up the majority workers of any category of work.
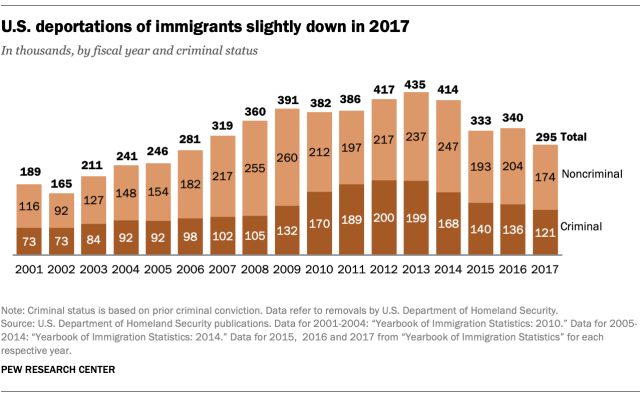
- Deportations of immigrants declined in 2017, well below the peak achieved under the Obama administration (Not discussed - detentions have increased dramatically). In no year since 2001 have people with a criminal record made up the majority of those deported!
- Border apprehensions are also down - from 1 million in 2006 to 397,000 in 2017 (this number will likely increase this year - though stay well below 2006).
- People from countries other than Mexico make up the majority of arrests along the U.S./Mexico border, with those from Central America being the largest group.
- 70 percent of those polled felt that immigration should be kept at current level (38 percent) or increased (32 percent). Those saying immigration should be reduced were 24 percent.
You can read the full statistical overview with accompanying interactive charts here.